When Obsidian is slow to start
How to narrow down the cause
This page was machine-translated from Japanese. Read the Japanese original
Preserve your original vault first, then troubleshoot plugins and settings in a copy. The 9 trials below use a small test vault created by the author, as an example of comparing the same conditions.
Preserve your original vault before changing settings
Back up your notes, attachments and settings, then test a copy of the vault. Disable all community plugins and compare how long it takes for the same note to appear. If there is a difference, re-enable the plugins one at a time and check again.
.obsidian in the settings backup. Before changing settings, confirm that the copy exists and that you can read a known note. These steps do not require deleting your original notes or plugin files.The troubleshooting steps below are suggestions for readers, not a diagnosis of your device. The measurements later in the article cover only the fixed conditions of the 1 note prepared by the author.
- Back upOriginal notes, attachments and settings
- Identify the symptomStartup, note display or editing
- Compare in a copyThe same note and measurement criteria
- Re-enable one at a timeRecord versions and changes
Identify the slowdown and test a copy
- Record which stage is slow.
Launching the app, opening a vault until its text appears, and searching, following links or editing are different symptoms. Record your OS, the Obsidian version, approximate vault size, recently changed settings and enabled plugins. - Check your backup and set aside a copy for testing.
Close the app, make a copy and preserve the original. Check the location so you do not confuse the test copy with an automatically synchronized vault. Avoid changing settings while both copies are open. You do not need someone else’s vault or unverified plugins. - Disable community plugins in the copy and compare.
Record the enabled plugins and their settings first. Then disable community plugins or use Restricted mode in their settings, restart, and compare how long the same known note takes to appear. Check menu labels for your version and language. A disabled plugin’s features will be unavailable. - If there is a difference, re-enable plugins one at a time.
Keep the same vault copy, note, core features and measurement criteria. Record each plugin’s name, version and the order in which you enabled it. Repeat each condition rather than drawing conclusions from the first launch or a single fast result. - If there is no difference, compare the vault and environment separately.
Check whether the same stage is slow in another vault containing a small note you created. Record other running apps, OS load, synchronization and storage conditions. Changing several settings or files at once makes it difficult to identify which change mattered.
Creating backups, switching to Restricted mode, re-enabling your plugins, and diagnosing synchronization or storage were not demonstrated in these 9 trials. The measurements used plugin enablement lists prepared in advance, with no interaction during startup and no rewriting of notes.
Compare 0, 1 and 2 plugins in a fixed small vault, with 3 trials each
Using the same Linux environment and author-created note, we compared conditions with 0 loaded community plugins, 1 with Templater only, and 2 with Templater plus QuickAdd. The median times until the note text appeared were approximately 0.92, 0.95 and 1.02 seconds, respectively.
| Plugins loaded at runtime | Trials | Measurement connection ready CDP ready | Known note text visible GUI text ready |
|---|---|---|---|
| 0 plugins: 2 disabled | 3 times | Median 324 ms Range 313–356 ms | Median 917 ms Range 892–949 ms |
| 1 plugin: Templater 2.25.1 | 3 times | Median 325 ms Range 315–339 ms | Median 948 ms Range 926–973 ms |
| 2 plugins: Templater 2.25.1 + QuickAdd 2.29.0 | 3 times | Median 329 ms Range 325–332 ms | Median 1017 ms Range 1016–1105 ms |
The distribution files for the 2 plugins were present even in the 0-plugin condition. Only the community-plugin enablement list changed. We checked the enabled list and the IDs and versions of actual plugin instances at runtime, confirming 0, 1 and 2 loaded plugins rather than merely counting installed manifests. The same 5 core features were enabled in every condition.
These medians do not establish a causal effect of plugin count alone or a general rule that more plugins always make startup slower. Plugin types changed along with their number, each condition had only 3 runs, and the shared CPU and cache were not held constant. Do not apply these differences directly to your own large vault or device.
What the startup timings measure
Connection readiness and note visibility are separate measurements
A monotonic clock measured elapsed time from just before launching the Obsidian process. The display environment was prepared before timing began. CDP ready marks when the measurement endpoint responded and its connection information was available. This alone does not establish that a note was visible.
GUI text ready marks when we used that connection to inspect the actual display and observed the heading “起動確認” in 起動確認.md together with the known verification marker. It includes startup, connection and readout time. It does not measure the first paint, completion of every plugin’s initialization, or when editing becomes possible. The loaded-plugin count was recorded separately after observing the note text.
Use the same input and sequence
- Official Obsidian 1.13.7. The app and installer versions were checked in the actual General settings screen.
- The same official distribution files for Templater 2.25.1 and QuickAdd 2.29.0 were copied into every condition. No new downloads or dependency installations were performed for these trials.
- The input was 1 Markdown file of 148 bytes, prepared directly by the author. Every condition used the same vault settings, 5 core features and distribution files for both plugins. Before launch, we compared all vault files except the enablement list. The note’s bytes and hash also remained unchanged after startup.
- The core features were file-explorer, backlink, outline, properties and bookmarks. No Templater startup template or QuickAdd choice, macro or AI configuration was executed.
- Before measurement, we defined 3 conditions with 0, 1, and 2 plugins and 3 trials each, then measured in the order
0,1,2 / 1,2,0 / 2,0,1. All 9 planned trials are reported. We neither selected only fast results nor removed outliers. - During measurement, we did not click the GUI, use the API to open or write notes, or run plugin commands. We checked state through read operations. For each trial, we saved the actual display and then cleanly closed only the app used for measurement.
Cache, load and profile limitations
Before measurement, we used a preparation profile to complete the actual trust confirmation and check the version in General, then copied the prepared settings into each trial. Each trial used new profile and cache directories, but preparation and repetition warm the OS page and disk caches. We did not reboot or clear OS caches, so these were not physical cold starts or first use with untouched settings.
We did not record a complete hash inventory of each global profile immediately before launch. We retained the shared prepared source settings, copying method and pre-launch checks of each vault’s files. We do not claim that every byte of every profile was identical.
In the shared environment, observed CPU utilization was approximately 35–44%, and other apps were running. There were 5 visible logical CPUs, a quota equivalent to 4 CPUs and a memory limit of 16 GiB. The CPU observation interval included measurement, state readouts and saving images; it does not represent individual plugins’ CPU usage. Another build was observed before preparation, but this does not establish that it was running throughout all 9 trials.
A pre-measurement stop and corrections to the record
During preparation, before any measurements were taken, a check for whether a cleanly closed app had released its endpoint stopped after confusing TCP TIME_WAIT with a listening connection. We retained the failure record, confirmed there was no listener and that connections were refused, and corrected the check. We then ran the 9 planned trials, which had not yet been performed. Preparation time was excluded from the samples.
Reviewing the original image inventory revealed that the preparation-stage trust dialog had been omitted from the expected count. We corrected that count from 11 to 12. We did not regenerate images, GUI states or timestamps. Only the recorded count changed; existing CSV files and other recorded bytes were preserved.
Inspect the original CSV, note and screenshots
The original CSV contains unrounded timings for all 9 trials, loaded-plugin counts and versions at runtime, shared load and exit results. You can inspect the raw values separately from the rounded table. The Markdown input was prepared directly by the author beforehand; it is not evidence of the app saving note content.
# 起動確認

著者作成の固定ノートです。プラグインの起動比較にだけ使います。

表示確認印 C21-STARTUP-20260930
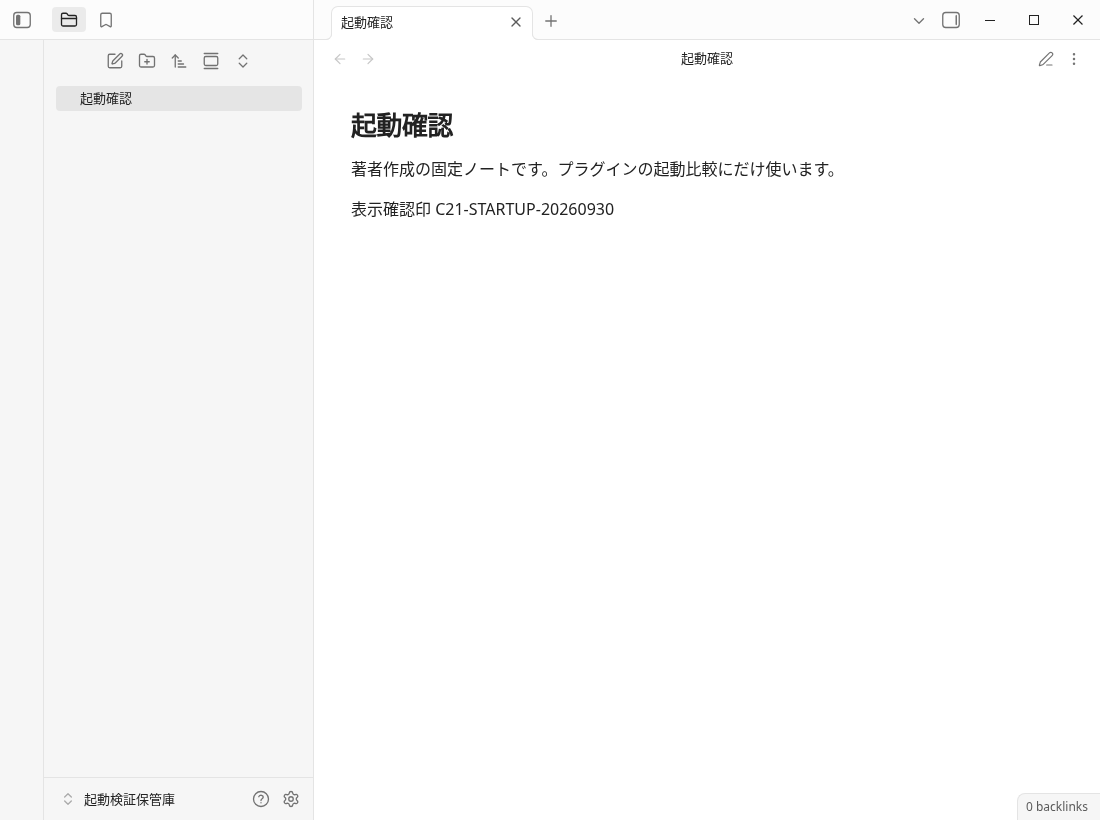
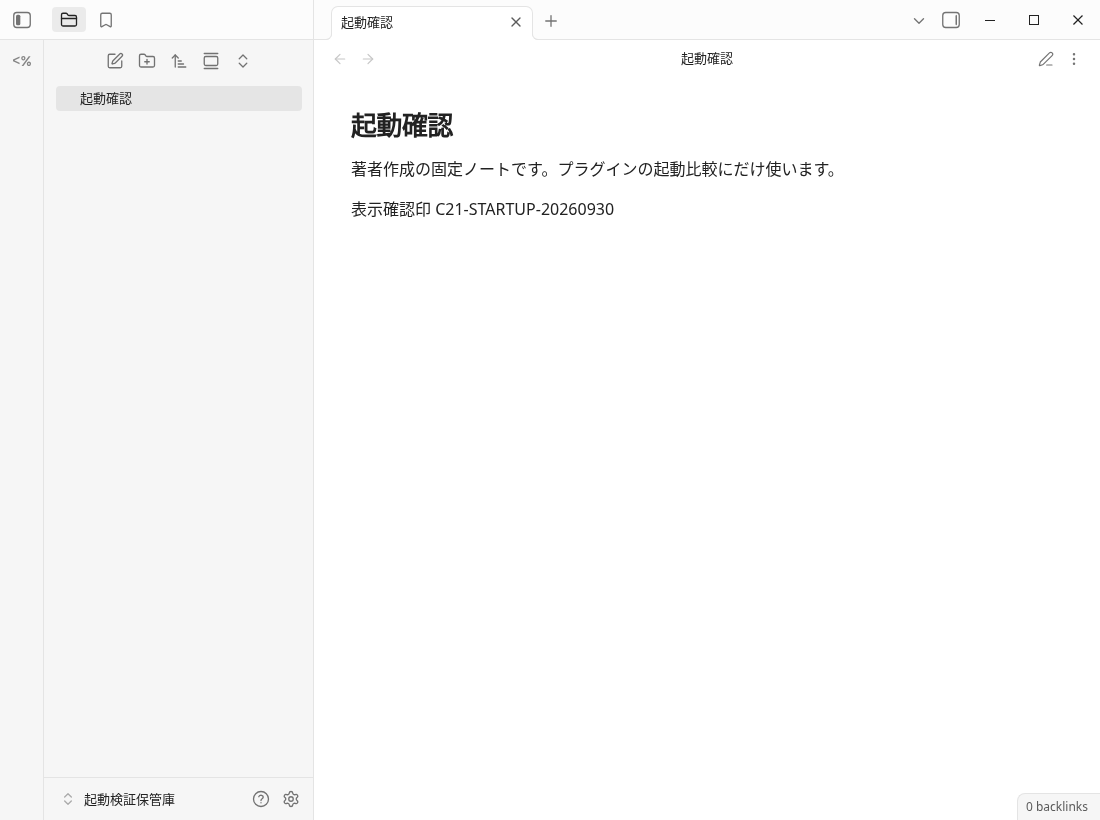
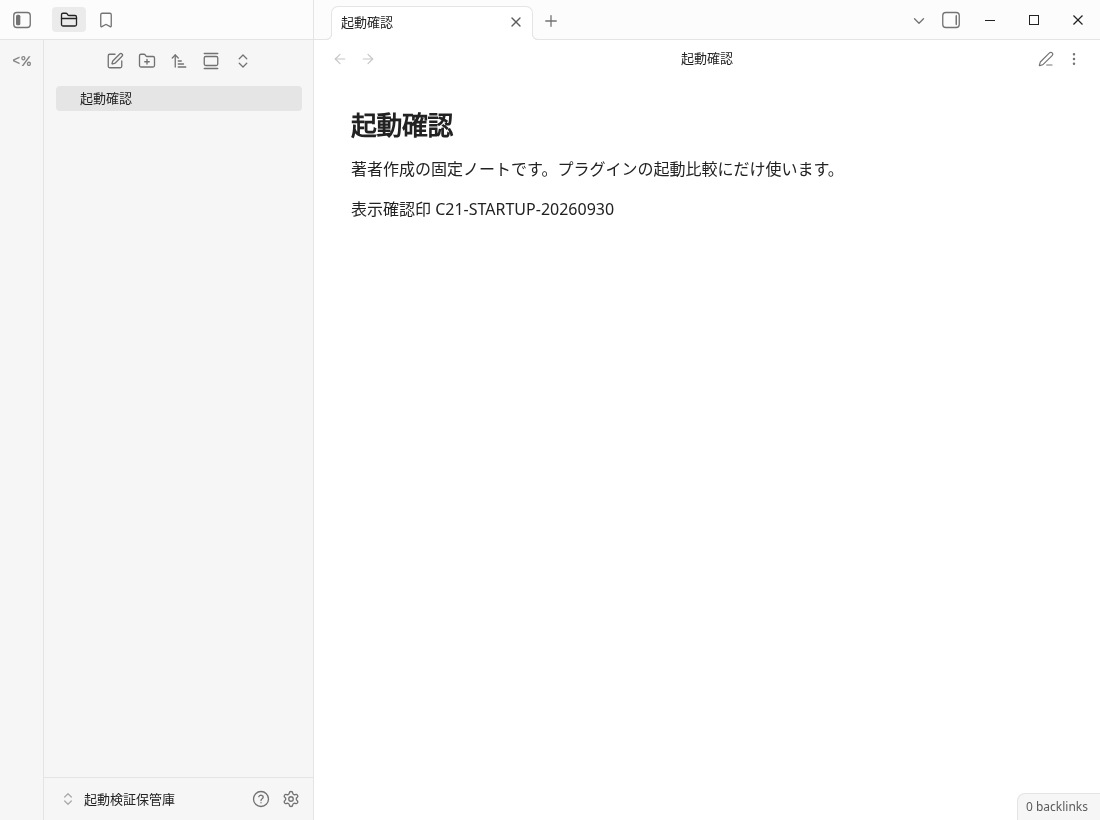
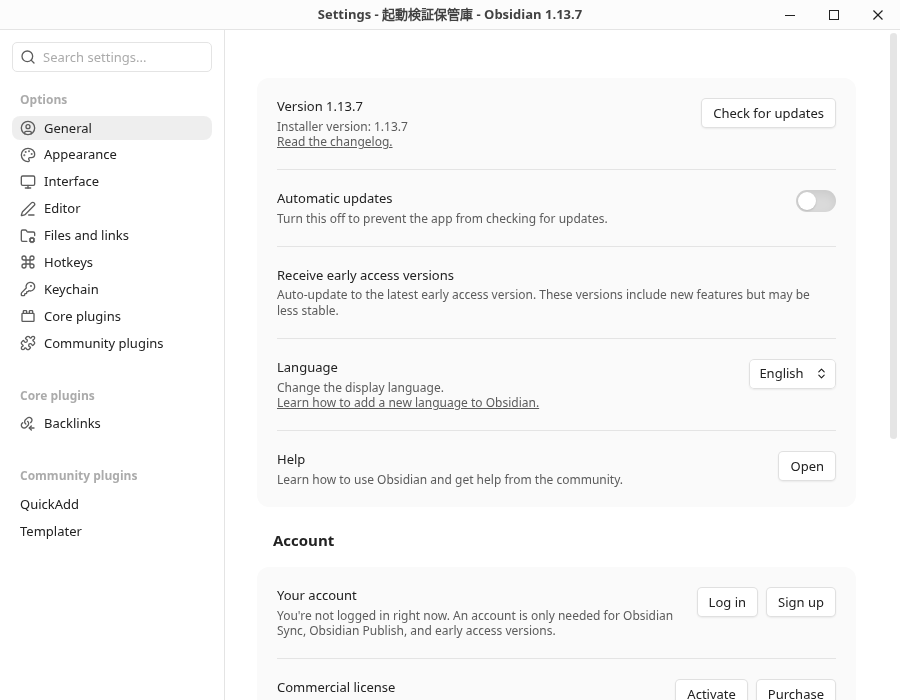
The 4 displayed images, CSV and Markdown are copies whose bytes and SHA256 match the frozen originals. The original verification receipt covers 23 checks and the bytes and hashes of 82 files; including the receipt itself, the matching scope contains 83 items. These 9 trials did not measure Windows, macOS, iOS, large working vaults, synchronization, SimpleMemo speed or productivity, or traffic effects. Measurement conditions and original-file verification record.